
This section lists development tutorials that focus on specific feature areas related to the Spresense development board. The purpose is to provide a quick start for developers for each of the specific areas that the tutorials cover.
1. How to read GPS information using the Arduino IDE
In this tutorial we will explore how to utilize the Spresense positioning features from the Arduino IDE. The built-in Global Navigation Satellite System (GNSS) receiver is one of the main features of the Spresense board, and the Arduino support library is designed to provide easy access to the most commonly used GNSS functionality.
The first two steps of this tutorial show how to get a basic application for receiving GPS data up and running. Subsequent steps add guidelines showing how to optimize signal coverage and decrease start-up time.
1.1. Basic setup for GPS
The GNSS module is initialized by creating an SpGnss object and calling its begin() method.
This powers on the hardware block and prepares it for positioning.
Then, for a basic example that uses GPS only, we call the start method without any parameter in the applications setup:
#include <GNSS.h>
static SpGnss Gnss;

void setup() {
    /* Setup serial output for printing. */
    Serial.begin(115200);

    /* Initialize GNSS. */
    Gnss.begin();
    Gnss.start();
}
This causes the GNSS module to look for satellites. When a fix is established, positioning information is acquired.
| A “fix” or “lock” is established when enough satellites have been located by the receiver to be able to determine its position. |
1.2. Receiving positioning data
To receive positioning data from the receiver, the application’s loop function waits for some data to be available and then gets it:
void loop()
{
  /* Wait for an update. */
  if (Gnss.waitUpdate(-1))
  {
    /* Get navigation data. */
    SpNavData NavData;
    Gnss.getNavData(&NavData);

    /* Print position and satellite count. */
    Serial.print("Lat=");
    Serial.print(NavData.latitude, 6);
    Serial.print(", Lon=");
    Serial.print(NavData.longitude, 6);
    Serial.print(", Satellites=");
    Serial.print(NavData.numSatellites);
    Serial.println("");
  }
}
The waitUpdate() method blocks the application and waits until some data has arrived.
The parameter to the method is a timeout determining for how long it should wait if nothing is received, but when set to “-1” it will wait indefinitely.
The SpNavData structure contains position data (latitude, longitude and altitude) and also information about all found satellites and their status.
For a full description, see the API reference.
1.3. More about update handling
By default, the GNSS module updates its positioning data once every second. This update rate can be modified during setup so updates are less frequent:
void setup() {
    Gnss.begin();
    Gnss.setInterval(5);    /* Update every five seconds. */
    Gnss.start();
}
The lowest possible update interval is 1 second. It cannot be set to 0. If no more updates are wanted stop the GNSS module.
Instead of blocking the application loop while waiting for an update, you can let the application poll for updated data whenever it needs it. This gives you full control of your application’s flow, but means you might not always get the latest updated data, depending on your update interval:
void loop()
{
  /* Check for an update. */
  if (Gnss.isUpdate())
  {
    /* Get navigation data. */
    SpNavData NavData;
    Gnss.getNavData(&NavData);
  }
}
You could instead use the waitUpdate() method with a timeout of 0 to achieve the same effect.
|
1.4. Improving coverage
The GNSS module uses GPS by default but also supports the GLONASS and QZSS positioning systems with some additional satellite-based augmentation systems. The supported options are shown in the following table:
GPS |
Global positioning system built by the United States. |
GLONASS |
Global positioning system built by Russia. Slightly less accurate than GPS but can be used together with others to improve positioning data in general. |
SBAS |
SBAS (Satellite-Based Augmentation System) is a generic term but in this context it refers to WAAS, a US augmentation system to GPS. It improves GPS positioning greatly but only works in the US. |
QZ_L1CA |
The Japanese Quasi-Zenith Satellite System (QZSS) Michibiki transmits positioning signals compatible with GPS L1 C/A signals, which improves positioning in East Asia and Oceania. |
QZ_L1S |
Improves accuracy of GPS and QZ_L1CA signals in Japan specifically. |
For example, so that your application also uses GLONASS for positioning, you must add it during setup using the select() method:
void setup() {
    Gnss.begin();
    Gnss.select(GLONASS);
    Gnss.start();
}| This method can be called multiple times in order to select combinations of systems and augmentations. |
There is also a corresponding deselect() method that stops the GNSS module from using the given option.
To check if a specific system is currently selected use isSelecting() with the given option.
1.5. Improving startup
When the receiver is first started it will take some time until satellites are found and a position can be determined. This delay is called TTFF (Time To First Fix). By selecting a suitable start mode and supplying initial data to the GNSS module, the TTFF can be greatly reduced.
Available start modes in the Arduino IDE are:
COLD_START |
Start positioning without any previous data. Everything needs to be downloaded from the satellites. |
WARM_START |
Use current position, time and almanac. Most of the data is reused but it might take some time to get a fix. |
HOT_START |
Use current position, time, almanac, and ephemeris. All data is available and a fix can be acquired immediately. |
Satellite data, such as position, almanac, and ephemeris, are lost when the device enters deep sleep or powers off.
To speed up TTFF at next start-up, these data can be saved to flash by calling Gnss.saveEphemeris().
This should only be done when positioning is deactivated, that is, after calling Gnss.stop().
The saved data will then be automatically read and used the next time a HOT_START is triggered.
| To prevent unnecessary wear on the flash memory, we recommend you only save satellite data to flash memory before entering deep sleep or powering off the device. |
If no mode is specified when calling start(), the GNSS module will try to use HOT_START.
However, if it is not possible to reuse any data it will fall back to COLD_START instead.
This could happen if, for example, some time has passed after the data was saved, because data received from the satellite is only valid for a limited time: two hours for ephemeris and 90 days for the almanac.
Current time is not included in the backup data.
When the module wakes up from being inactive, for example when the device wakes up from deep sleep, the new GPS time is calculated using the time elapsed in the Spresense Real Time Clock (RTC).
At boot however, the RTC is set to 0, so if the application knows the time and date to within 60 seconds, before initiating a hot start, use the setTime() method to supply the time and date.
It might also be a good idea to set an initial position using setPosition() if it is believed to give a better approximation than the saved data.
Note that setting time and position should be done when the receiver is in idle mode, i.e. before any positioning is started.
    # Note that this code is only a conceptual explanation for setting stored time and positioning values.
    # The values should probably not be hardcoded.
    SpGnssTime current_time;
    current_time.year = 2019;
    current_time.month = 6;
    current_time.day = 25;
    current_time.hour = 12;
    current_time.minute = 00;
    current_time.sec = 00;
    current_time.usec = 0;
    Gnss.setTime(current_time);

    double lat = 55.718272;
    double lon = 13.225060;
    double alt = 84;
    Gnss.setPosition(lat, lon, alt);

    Gnss.start(HOT_MODE);
1.6. Testing your GNSS application
Here are some general things to be aware of when testing your GNSS application:
-
The receiver needs to find at least four satellites to be able to determine its position.
-
Make sure you have a clear sight of the sky. The receiver might not find a satellite if there is something blocking its line of sight, such as a roof.
-
Avoid obstructions around you. Satellites may be positioned low towards the horizon, so buildings with lots of concrete, metal girders, and so on could block signal to the receiver.
-
Depending on the conditions and the state of the device it might take minutes to get a fix, so please be patient.
2. Equipping Spresense with WiFi connectivity
You can set up Spresense for WiFi connectivity either by adding a Wi-Fi module directly to the Spresense main board or by using the Spresense extension board together with a WiFi Arduino shield.
This tutorial explains how to equip Spresense with WiFi directly to the main board, but if you are using a WiFi Arduino shield follow the instructions from step 2.
2.1. Connecting WiFi directly to the Spresense main board
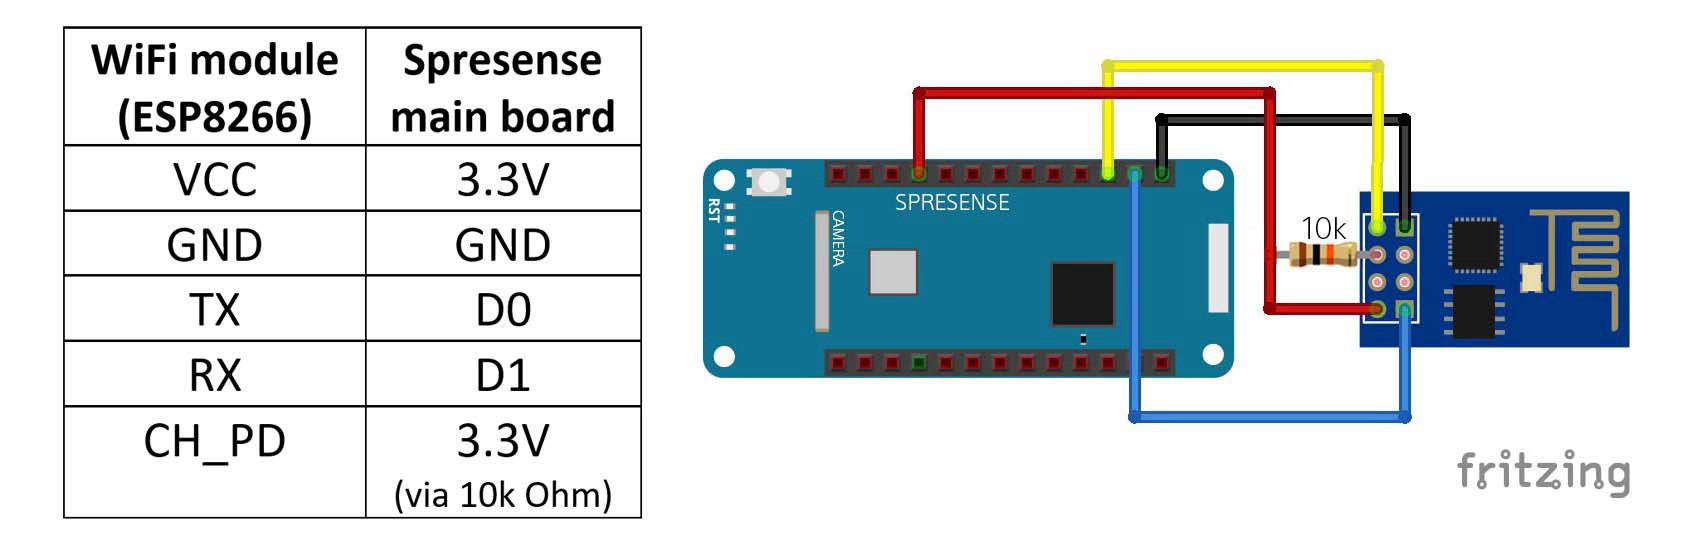
To equip Spresense with WiFi you need to connect five wires to the WiFi module. In this example, we show how to use an Arduino library with an ESP8266 ESP-01 WiFi module.
Here is the list of components you need for this example:
-
Two Spresense main boards
-
Two WiFi modules (ESP8266)
-
A 10k ohm resistor
-
A USB micro cable (or two if you don’t want to move it between the boards)
Do the following:
-
Connect one WiFi module on each Spresense main board using the pins shown in the table in the following diagram:
-
Download the Arduino WeeESP8266 library from: https://github.com/kamtom480/ITEADLIB_Arduino_WeeESP8266, click Code > Download ZIP.
-
Install the WeeESP8266 library in the Arduino IDE. Navigate to Sketch > Include Library > Add .ZIP Library, then navigate to the .zip file’s download location and open it.
-
Click: File > Examples > ITEADLIB_Arduino_WeeESP8266 > TCPServer.
Once the file is open, set SSID and PASSWORD to your own choices.

-
Upload this sketch to the first Spresense board.
If this is your first time uploading a sketch to a Spresense board, please follow the Spresense Arduino Library Getting Started Guide.
-
Open the serial monitor connected to the first Spresense board and set the baud rate to 9600.
-
Copy the STAIP address shown in the serial monitor window. It will look something like the following example:

-
Open: File > Examples > ITEADLIB_Arduino_WeeESP8266 > TCPClientSingle.
-
SET SSID and PASSWORD to your own choices.
-
Change HOST_NAME to the address copied from Step 8.

-
Upload this sketch to the second Spresense board.
-
Open the serial monitor connected to second Spresense board and set the baud rate to 9600.
-
You should see information about incoming packets from the second Spresense board.


3. Program Spresense using Python from Zerynth
Follow these tutorials if you want to learn how to program your Spresense board in Python, with Zerynth Studio.
Zerynth Studio is free to download and available for Windows, Linux, and Mac OS.
Tutorials:
| The above tools, tutorials and related information is developed by Zerynth and not Sony. Zerynth has the full quality ownership and responsibility. For questions and developer support, please contact Zerynth. |
4. How to connect Spresense to a cellular network
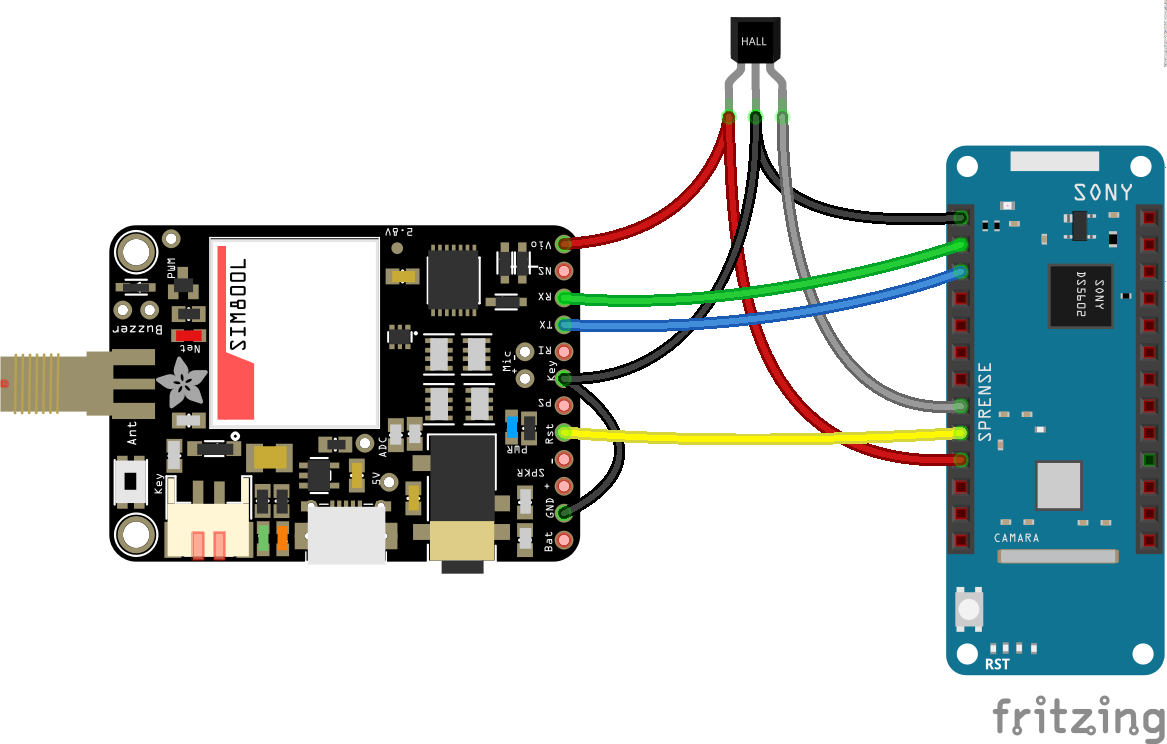
In this example we will equip Spresense with an Adafruit FONA MiniGSM module, hook it up to a Hall effect sensor and then transmit registered sensor values over the cellular network. For simplicity we will publish the gathered data on the dweet.io website where it will be displayed as a graph.
We will count the number of times that the sensor is triggered and upload the accumulated value once every minute.
A Hall sensor detects the proximity of a magnetic field and will signal whenever it is close to some kind of magnet. A real-life application of this could be to gather information about when or how often a gate is opened or, if mounted near the wheel, calculate how far a rental bike has travelled to know when it is time for maintenance.
Using a Hall sensor is of course just done as an example and can be replaced with any other data gathering method.
4.1. Materials
-
Adafruit FONA MiniGSM module
-
SIM card that supports GPRS
-
An antenna
-
Li-Poly or LiIon Battery, 1200 mAh or larger
-
Hall sensor component. For example, TLV49645
-
A magnet (a regular whiteboard magnet or similar will do fine)
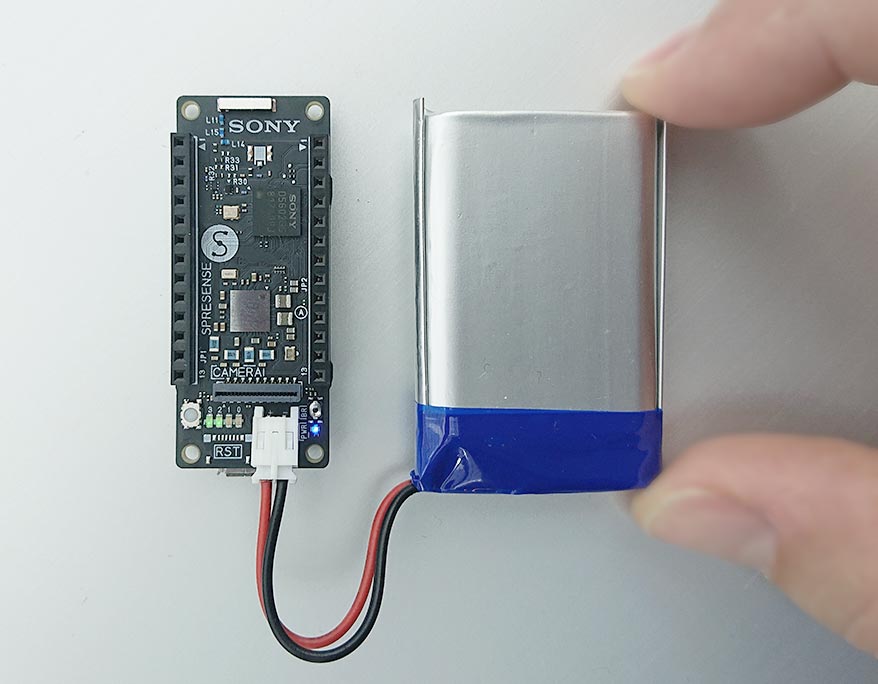
The FONA module is available in two versions with different antenna connectors (SMA or uFL), so make sure to get an antenna that matches it. An external battery also needs to be connected to the modem because USB alone won’t be able to drive it during current spikes in its operation.
4.2. Connect the hardware
|
|
-
Insert a SIM card into the FONA module.
-
Connect the antenna to the FONA module.
-
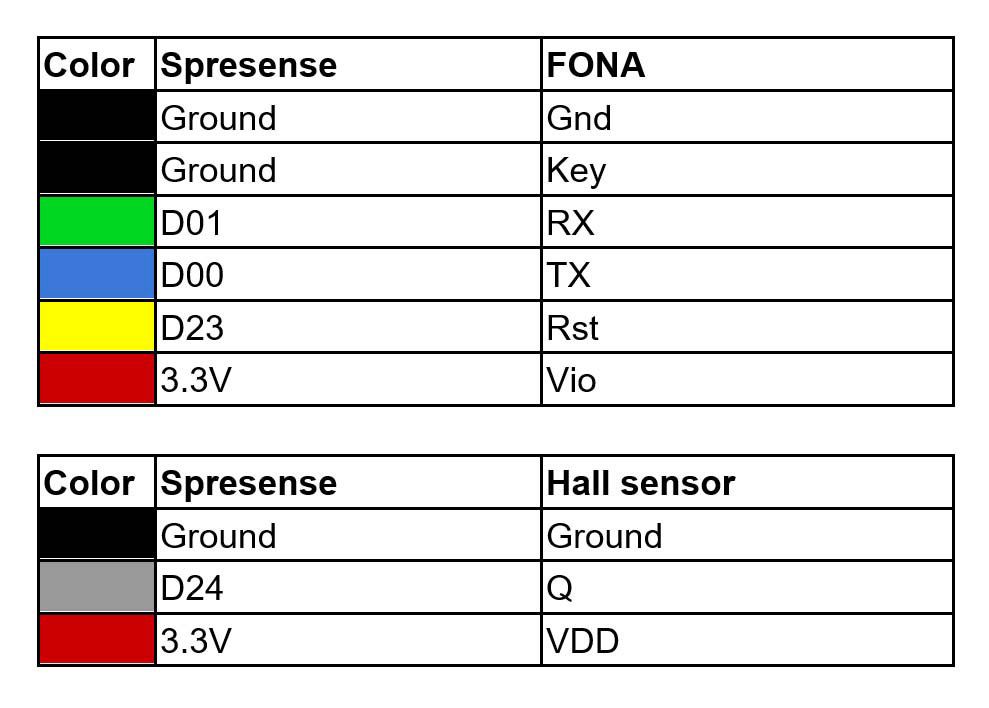
Connect the FONA module and the Hall sensor to the Spresense board as shown in the the wiring diagram.
-
Connect the battery to the JP1 connector of the FONA module.
It is common practise to attach a pull-up resistor to the data pin of a Hall sensor, but in this tutorial we configure the input pin of the Spresense board to use its internal pull-up instead.
4.4. Configure the application
The following parameters need to be configured before you run the application. Load the sketch in the Arduino IDE, and find and update the following defines:
DWEET_THING_NAME
The name used to publish your data on the dweet.io site.
Choose a unique name that someone else is unlikely to be using.
FONA_APN
This is the access point name provided by your mobile operator.
It is needed to access the internet using GPRS.
FONA_PIN
This string is commented-out by default but should contain the PIN code of your SIM card if it needs to be unlocked by the application.
Leave it commented-out if not needed.
4.5. Run the application
-
Make sure you have the battery connected to the FONA module.
-
Upload the sketch to the Spresense board using the Arduino IDE and open the serial monitor.
-
Construct a web address by adding the name you choose for
DWEET_THING_NAMEto the dweet.io URL, For example:
https://dweet.io/follow/gsm_test_123 if the name isgsm_test_123, and open it in a web browser.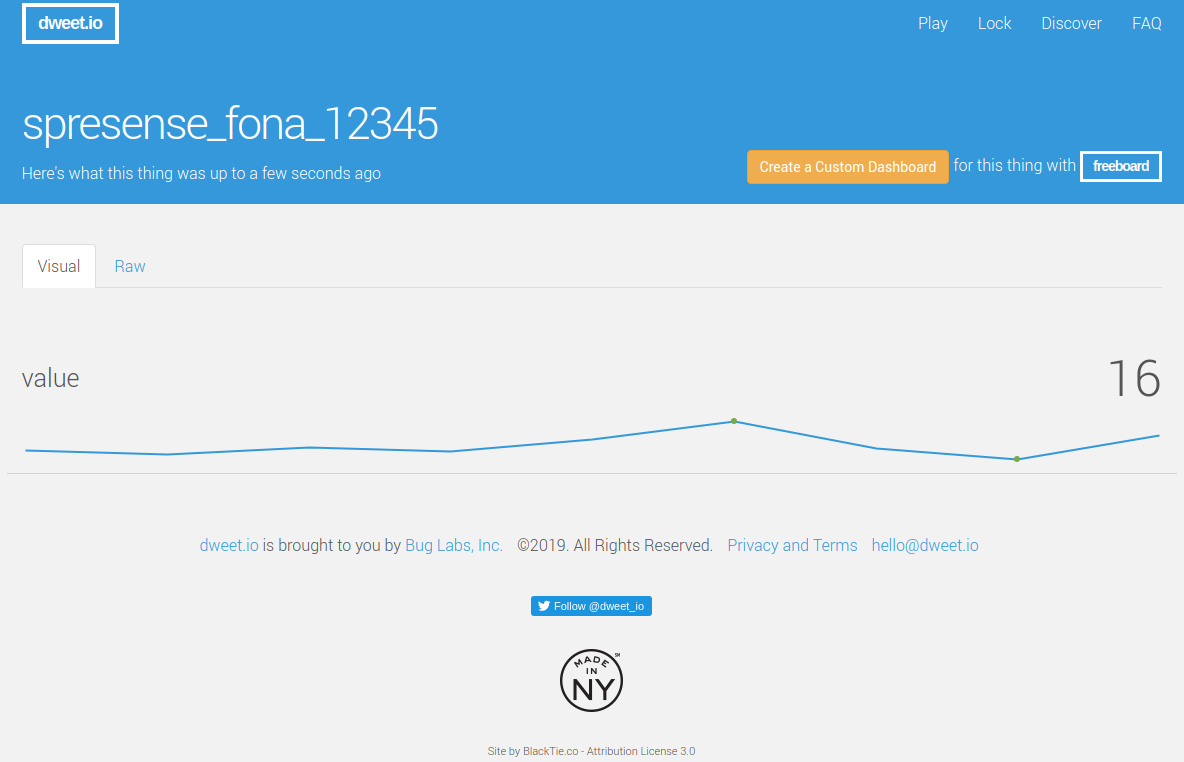
-
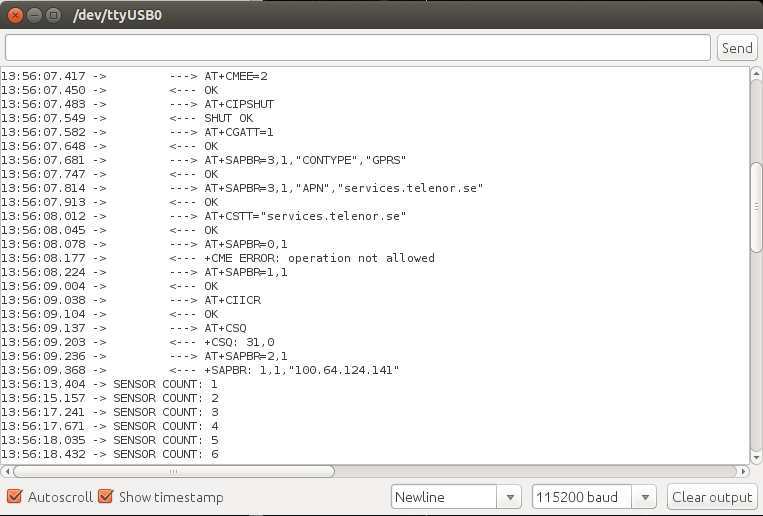
Once the board is running, touch the Hall sensor with the magnet and you should see the updated sensor change count value in log output in the serial monitor of the Arduino IDE, for example: SENSOR COUNT: 1. Repeat this a number of times to gather some data to be transferred with the modem.
-
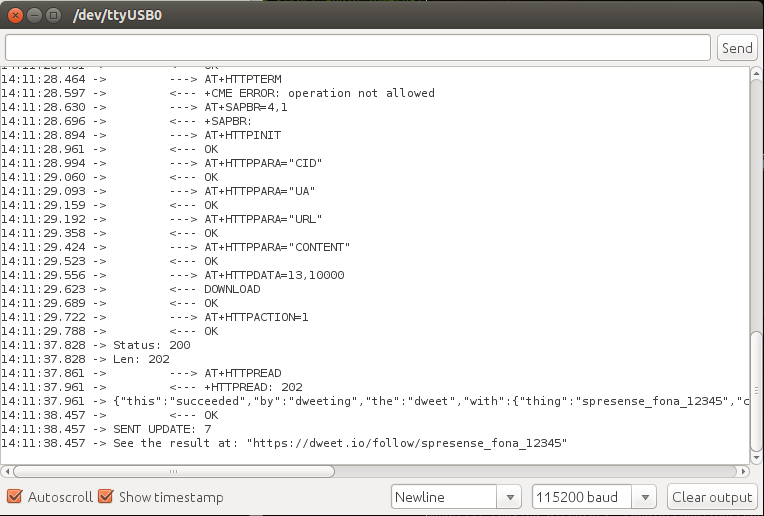
After the set sleep period has passed you will see printouts in the log in the Arduino serial monitor from when the FONA module is started and eventually the data will be sent.
-
If the data transmission was successful you should see the message SENT UPDATE: in the serial monitor log and the dweet.io web page should automatically be updated with the new value.
If you play around with the code and the FONA ends up in a bad state so it cannot connect anymore, disconnect the battery and the USB cable and reconnect them again to reset.
| The FONA module has a built-in charger circuit, so if the battery runs out (you will see warnings about it in the log in the serial monitor of the Arduino IDE), disconnect the USB cable from Spresense and connect it to the FONA USB connector instead. A green light on the module indicates that the battery is fully charged. |
4.6. Appendix
4.6.1. Brief code overview
GSM module communication This example application uses the FONA support library provided by Adafruit. Since the module is controlled using AT commands over UART we simply need to set up a software serial instance using our selected pins (FONA_PIN_TX and FONA_PIN_RX) for the TX transmit and the RX receive line. Then, when initializing the library using its begin function, we just provide our software serial instance to it.
We also need to connect the module’s reset pin to Spresense to be able to initialize it. The Spresense pin name (defined as FONA_PIN_RST) is provided to the constructor when instantiating the support library in our application.
Data update handling In this rather minimal example sending data to the server is done by executing the following steps:
-
Enable GPRS.
-
Generate an HTTP JSON request using the dweet.io URL and updated value.
-
Send the request to the server and retrieve the status code from it.
-
Write the full server response to the serial log for reference.
All underlying AT commands and data handling are handled by the FONA library, so we don’t have to worry about it.
Update frequency The application is set to send an updated value to dweet.io once every minute by default. The number of seconds between updates is defined by the value UPDATE_SLEEP_S. TE: It takes about 20 seconds for the modem to connect to the server, send data and receive a response. Therefore, keep the sleep value well above this to avoid any conflicts when trying to initiate a connection while a previous one is still ongoing.
Sensor handling
The task of connecting to the network and sending an update takes a bit of time, approximately 20 seconds, and will block the caller while being executed. Therefore, an interrupt handler (sensor_interrupt) is attached to the sensor input pin.
This captures all sensor state changes so they can be recorded in a global hit count variable regardless of the overall application state.
When it is time to transmit a new sensor hit count value, we must first make sure that we don’t run into trouble if we happen to try to read and write the variable at the same. To avoid this, we first disable interrupts, read the value and then enable interrupts again.
| The hit counter is also reset right after it is read, so any sensor events triggered while the modem is doing some transfer will be included in the next update. |
5. Predictive maintenance with Spresense
This is a tutorial for using Spresense in predictive maintenance (PDM) applications. A PDM use case could be to read input from an industrial accelerometer attached to an electrical motor, process the data and then send it to a cloud-based PDM service.
In the example in this tutorial, a sensor is connected to the microphone input A of the Spresense extension board. We use this input, instead of using one of the analog A/D inputs, because it can handle higher sample rates and so provide readings with a higher fidelity.
To understand the basics of PDM in the context of Spresense, read this short blog post: Using Spresense for predictive maintenance.
5.1. Online service for analysis of data
The online PDM service used in this demo is senseye.io. Senseye is a PDM service provider that specializes in analyzing sensor data from their customers and then using advanced data analysis methods to predict maintenance needs.
You can choose another PDM service, but in that case you must modify the source code to support the REST API of that service. You can find the API strings and associated functions handling in:
examples/pdm_demo/pdm/api_senseye.c
5.2. Hardware components and requirements
The hardware components used in this demo are:
-
Spresense main board
-
Spresense extension board
-
IDY Wi-Fi add-on board for Spresense (IDY product page)
-
Hansford HS-100 accelerometer (Hansford product page)
-
SD card
-
Electronic components (including resistors and capacitors) depending on the sensor used.
The sensor will be connected to one of the microphone inputs of the Spresense extension board so that it can be sampled at a high frequency. There are a number of manufacturers producing accelerometers with different forms, outputs and sensitivity levels. Whichever you choose, the sensor output signal needs to be converted to a level within the range the microphone input can handle (0-1.8 V). Also, we have to provide power to the sensor itself.
To satisfy the hardware requirements, we implement the sensor interface as described in Integrated Electronics Piezo-Electric (IEPE). In general terms, this means:
-
The sensor circuit is driven by a constant current.
-
Both the power supply and the sensor signal are transmitted using a single shielded coaxial cable.
-
In the instrument end, where the signal is read, there is a coupling capacitor to get rid of the DC component of the input and only keep the actual sensor signal.
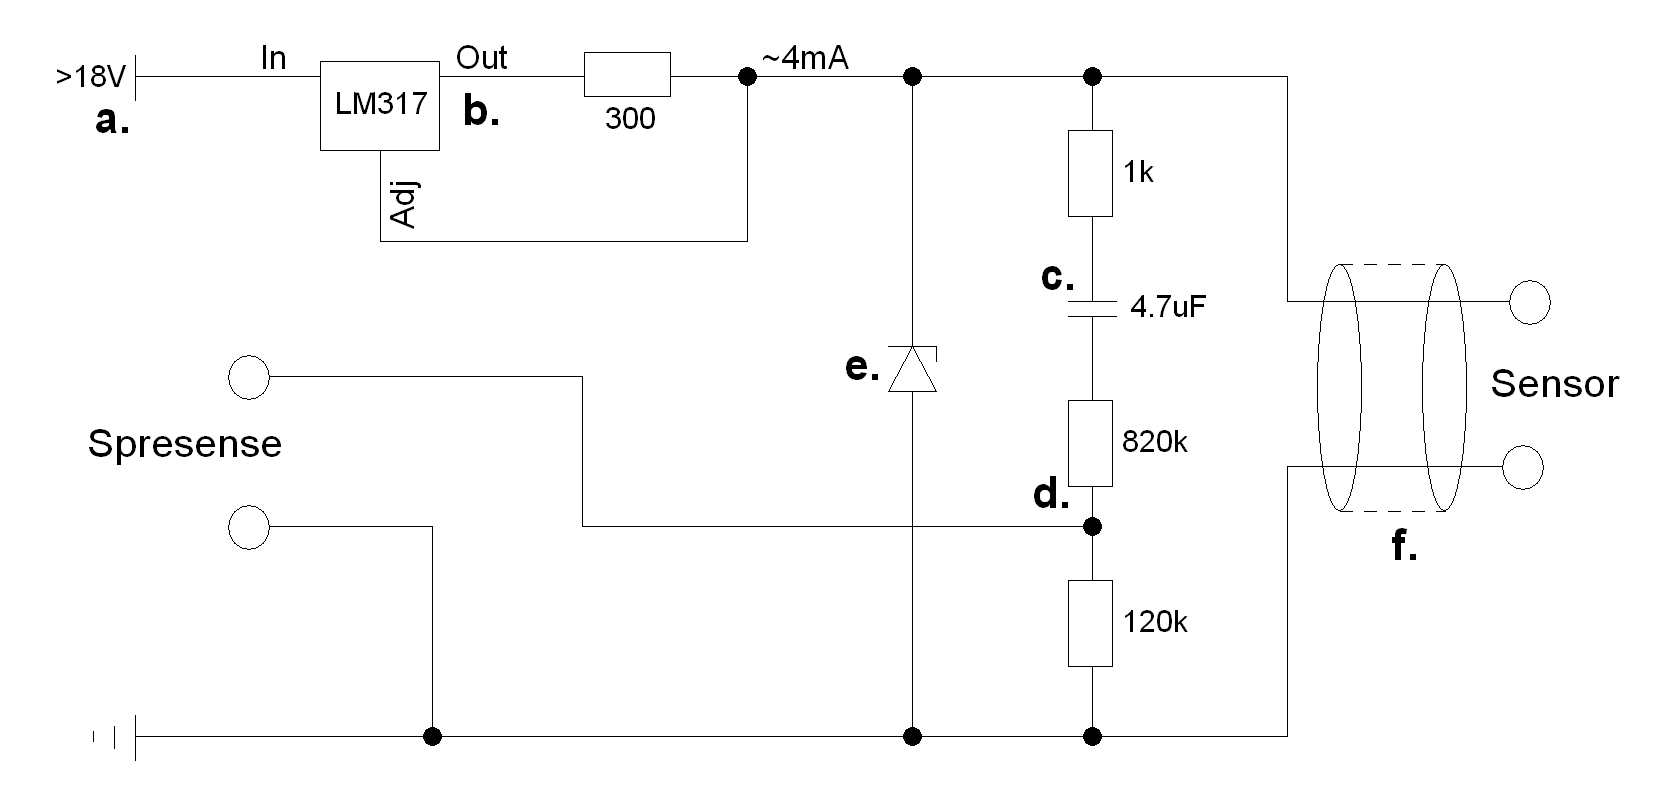
As well as the IEPE specific components mentioned above, we also need to bring the signal voltage down to a level that the Spresense board microphone input can handle, so a small voltage divider circuit is needed. An overview of the setup is shown in the following diagram:
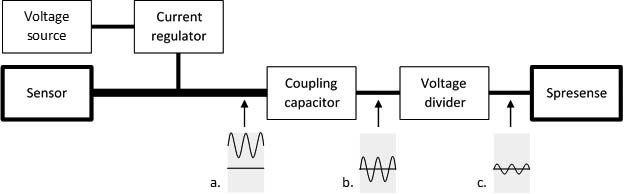
The signal representations marked a., b., and c. at the bottom of the diagram show how the signal changes around the zero voltage baseline at different points in the network. You can find a detailed schematic can be found in the section Set up the hardware below.
The following sections describe the set-up and how to run the software.
5.3. Software structure
The source code is divided into a number of modules with the most important ones shown in the following illustration:
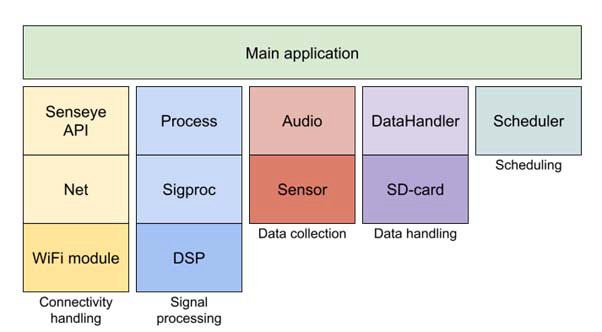
Connectivity handling
The connectivity modules (Senseye API and Net) handle setting up the Wi-Fi hardware, setting up the HTTPS connection to the server and sending and receiving HTTP requests and responses. The API module is web-service-specific and needs to be modified/replaced if another service using another REST API is used.
Signal processing
The signal processing modules (Process and Sigproc) do all signal processing operations on the acquired vibration data. The Process module is the main interface for this and is called whenever a data buffer is available when measuring. The Process module also does some time domain processing itself and interface module, to the DSP where the FFT is run.
Data collection
The Audio module records vibration data from the microphone input as if it was regular audio data. When a full data buffer is acquired, it is sent back to the caller using a callback function. In this demo, recording is done using a single channel with a sample rate of 48 kHz.
Data handling
The DataHandler module is responsible for taking the data processing result received from the DSP, converting it to a JSON string and keeping it in temporary storage (the SD card). When a report is to be generated and sent to the server, this module reads all the previously stored JSON data, generates the complete JSON structure to be sent and then prepares the temporary storage for receiving new data.
Scheduling
To make sure measurements are taken and data is reported in a timely manner at a specific interval, a simple “Scheduler” module is introduced. At application start-up, one or more tasks (callback functions) are registered together with the interval at which they should be run. The application then hands control over to this scheduler, which goes to sleep and only wakes up when any of the registered tasks are required to be run.
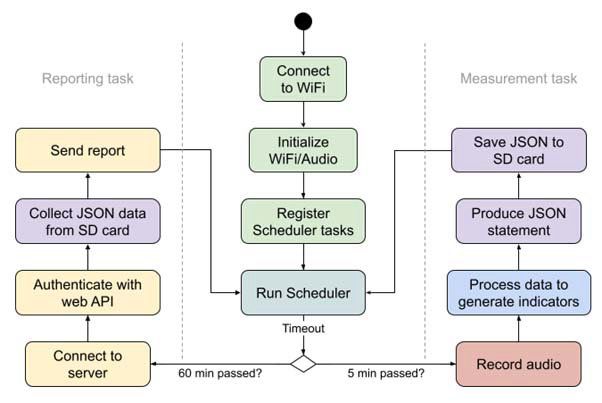
5.4. Software execution flow
In the default setup, the Scheduler component keeps track of two different tasks that are being run at different intervals: one measuring task that does data collection and processing, and one reporting task that sends the aggregated data to the web service. The general flow of the application can be seen in the illustration below. Note that the colors correspond to those of the components in the previous image showing the modular structure of the source code:
5.5. Measurement processing
The measurement data is processed by the software to extract a number of different condition indicators, which are eventually sent to the web API. Calculations that depend on frequency analysis using Fast Fourier Transforms (FFT) are done on one of the sub-cores, which acts as a dedicated DSP. Implementations of FFT and other signal processing algorithms are provided by the CMSIS DSP library which is included in the Spresense SDK. The following indicators are calculated and reported to the web service in this demo:
1xRPM, 2xRPM and 3xRPM
These are the frequency components at one, two- and three-times running speed. So, if the motor runs at 1500 RPM, which equals 25 Hz, then 1xRPM will show the waveform energy around that frequency. 2xRPM and 3xRPM do the same thing but show the energy at two and three times the frequency respectively. An increase in these values could indicate that the shaft is misaligned or bent.
Bearing BPFO, BPFI, FTF and BSF
BPFO (Ball Pass Frequency Outer race), BPFI (Ball Pass Frequency Inner race), FTF (Fundamental Train Frequency) and BSF (Ball Spin Frequency) are characteristic frequencies that show different aspects of a bearing. As with 1xRPM etc. mentioned above, they show the energy at those specific frequencies and indicate faults in different parts of the bearing itself. These frequencies are specific to the model of the bearing being used and should be provided by the bearing vendor.
RMS
RMS (Root Mean Square) is a mean measure of the overall energy in the waveform. An increase here does not pinpoint a specific problem but is a general indication that there might be an issue, such as shaft misalignment, a faulty bearing or something else.
Crest Factor
The crest factor is the ratio of the peak signal value to the RMS. Like RMS, this is also not a very specific indicator and an increase of this value could imply a number of different issues.
Peak to Peak
This value indicates the maximum difference between the lowest and the highest signal value, that is, the spread, in the waveform. This does not pinpoint any specific error, but if this increases it means that there is a general increase in vibrations, which could be a warning signal that something is wrong.
5.6. Set up the hardware
Prepare the adapter
Prepare the adapter circuit board according to the schematic below. You might have to adjust the values of the components depending on sensor type and other factors.
Note the following:
-
The voltage supplied to the circuit (a) should be at least 18V.
-
A constant current source (b) is used to drive the sensor. In this example an adjustable regulator of type LM317 is used, but this could be replaced with a current-regulating diode (CRD).
-
The coupling capacitor (c) removes the DC component (the bias voltage) resulting in a zero-centered AC signal that only includes the vibration data.
-
The resulting sensor signal needs to be scaled down to a level that the microphone input can handle (0-1.8V), and this is accomplished with a regular voltage divider (d).
-
The diode serves as overvoltage protection, protecting the sensor and the Spresense board during unexpected power surges.
-
Make sure that proper shielding of the cable used to connect the sensor (f) is applied to achieve a good signal-to-noise ratio. Make sure it is properly grounded.
Connect the sensor
-
Attach the board to the microphone, (MIC A), input and ground pins on the extension board. The bias pin (MIC BIASA) is not used. Please refer to the microphone pin header overview.
Prepare the Spresense board
-
Attach the Wi-Fi addon module to the Spresense main board. Please reference the images on the IDY Design product page to make sure it is put in the right place.
-
Attach the main board to the extension board.
5.7. Set up the software
Get the source code
The code for this demo is located in the following Github repository: https://github.com/sonydevworld/spresense-tutorials.git
This repo only contains Spresense demo applications and the corresponding configuration files. To build it you must first download and set up the SDK according to the one of the Spresense SDK Getting started guides in the documentation.
Once you have the SDK in place, download the Spresense tutorials source code repo by running:
cd spresense-tutorials
From this downloaded repo, copy the whole directory of the example application (pdm_demo) into the examples directory of your Spresense SDK.
Copy the folder containing the corresponding configuration (in this case configurations/pdm_demo) into the sdk/configs/examples directory of your SDK.
When all the source code is in place, change working directory to the sdk folder of your SDK repo and proceed with building it.
Build and flash the software
Building the software is done as with any other Spresense SDK application.
-
When you have downloaded the code, enter the sdk subfolder and run:
./tools/config.py examples/pdm_demo./makeThe build process will result in two separate binary files.
-
Flash the main software as usual:
./tools/flash.sh -c nuttx.spkThe DSP signal processing binary should be placed on the SD card so that the main software can find and load it at startup:
-
Create a new directory called BIN in the root of your SD card.
-
Copy the file examples/pdm_demo/sigproc/dsp/DSPFFT into the BIN folder on the SD card.
Configure the software
The software is configured by providing a configuration file that must be placed on the SD Card. The reason for this setup is to enable reconfiguration without having to rebuild the software and flash the board. It also avoids having to keep login credentials and other sensitive data in the source code.
A template file is available at examples/pdm_demo/config/pdm.config. The configuration is specified using the format :, and lines starting with a hash (#) are comments and will be ignored.
The settings include Wi-Fi and web API login credentials, sensor and bearing specifications, and motor speed. Fill in the missing values to match your setup and copy the file to the root of the SD card.
5.8. Run the demo
The demo is prepared so that it can either be manually started (the default configuration) or run automatically at startup.
To manually start the application:
-
Start a serial terminal application on your PC.
-
Connect the Spresense board to your PC using a USB cable.
-
When the command prompt is available in the terminal application, run:
pdm_demo
To make the application start automatically when the USB cable is connected, modify the SDK according to these steps:
-
In the “SDK” folder, run:
make menuconfig. -
When the configuration UI pops up, enter the
RTOS Featuresmenu and selectTasks and Scheduling. -
Set the value of “Application entry point” to:
pdm_demo_main. -
Save the configuration and exit menuconfig.
-
Build the software and flash it to the board.
| At startup, the application will try to automatically sync system time over the network. If it fails to establish a connection for this, the board will restart and try again. |
The startup sequence of the application is shown in the following flow diagram:
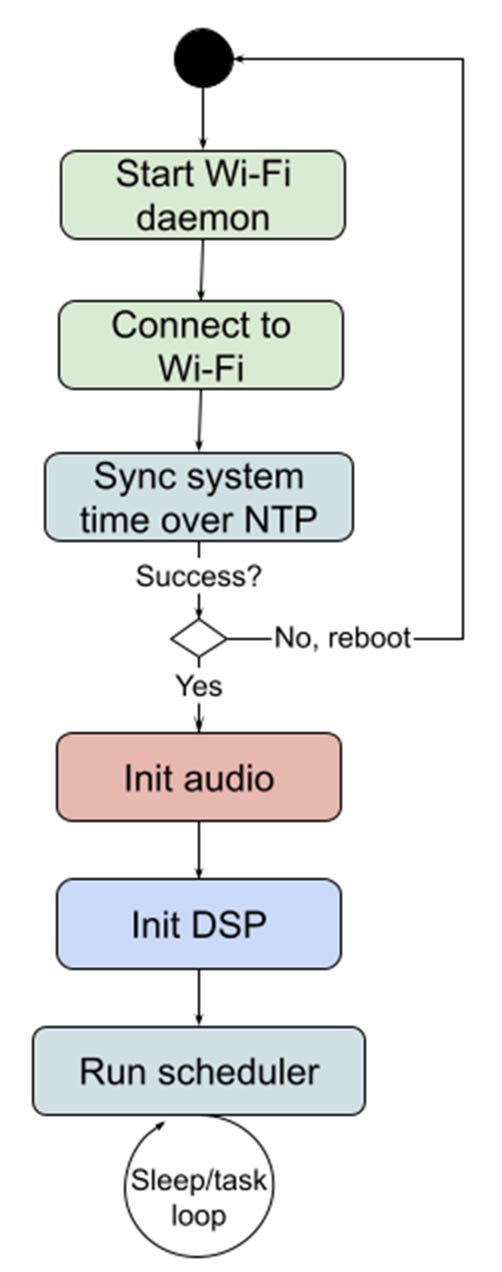
Once the demo is up and running, you should see in the log when application sleeps, wakes up to do a measurement or sends a report to the server.
| If you don’t have a Senseye account and just want to test doing measurements without actually sending anything, you can disable the command that does the reporting: |
-
Open up the source file pdm_demo_main.cxx.
-
Find the line:
//#define SKIP_API_POST. -
Uncomment it so you get:
#define SKIP_API_POST. -
Rebuild and flash the application.
6. How to equip Spresense with LoRa connectivity
LoRa (Long Range) is a good connectivity option if your application requires longer range connectivity with low power consumption. However, the data throughput is relatively low and the transmission is bound to certain transmission slots. A suitable use case is to read simple sensor data that is not too time-critical.
In this tutorial we describe how to set up Spresense with LoRa and do a basic transmission. We’ll be using two Spresense main boards with a LoRa module on each board. One will be the transmitting side and one will be the receiving side with an Arduino sketch controlling each board.
6.1. Equipping the Spresense main board with LoRa
You will need the following components:
-
Two Spresense main boards
-
Two LoRa modules (for this example we’re using Adafruit RFM95W)
-
An 8.2 cm wire to solder on the LoRa module to use as the antenna.
Do the following:
-
Cut a stranded or solid-core wire to 8.2 cm length. Strip off 1 to 2 mm at the end of the wire, tin and solder it into the ANT pad on the LoRa board, as indicated with the arrow in the following image:

-
Connect the LoRa module to the Spresense main board using the following pins:

-
To test LoRa with the Spresense board, we will need some simple-to-use Arduino sketches fit for the purpose. Download the ZIP from: https://github.com/sandeepmistry/arduino-LoRa.
In the Arduino IDE, navigate to Sketch > Include Library > Add .ZIP Library.
Navigate to the .zip file’s download location on your computer and open it.
-
In the Arduino IDE, go to Open File > Examples > LoRa > LoRaReceiver.
To set up the communication between Spresense and the LoRa module, we need to add the following two lines of code before
LoRa.begin(915E6):LoRa.setSPI(SPI5); // SPI of the Spresense main board rather than the extension board.LoRa.setPins(18, 26, 25); // Pins connected to the LoRa module.
Upload this sketch to first Spresense board.
-
Open File > Examples > LoRa > LoRaSender.
Add the same two lines of code for the sender sketch before
LoRa.begin(915E6):LoRa.setSPI(SPI5);LoRa.setPins(18, 26, 25);Upload this sketch to second Spresense board.
-
Open the serial monitor connected to first Spresense board and set the baud rate to 9600. You should now see information being sent from the sending Spresense board to the receiving board through LoRa.

For a more advanced LoRa communication with Spresense, please check out the “Spresense GPS tracker” project which tracks the Spresense unit on an online map: www.hackster.io/141676/spresense-gps-tracker-5e4fe8


7. How to make Spresense run on a battery for more than six months
In this tutorial, we explain some basic ways to make Spresense applications more power-efficient. This is crucial when running Spresense on a battery so that a single charge lasts as long as possible.
This tutorial uses the LowPower Class Reference class of the Spresense Arduino extension library to explain the steps. You can also implement it using the Power Management API of the Spresense SDK.
This tutorial explains how to use the advanced power management on an application level. The Spresense board can achieve an even greater power efficiency with a modification to the hardware.
| Modification requires professional soldering skills and will void the warranty. Please see the Hardware Guide for instructions for how to do this. |
First, we’ll go through the key parameters to optimize the power efficiency:
-
Sleep modes
-
Clock speed
-
Data storage
-
Extension board
-
Battery and peripherals
Then we’ll go through a GPS tracker demo use case along with the Arduino code for it.
7.1. Sleep modes
In many applications it is not needed to have the Spresense active at all times. If, for example, it is used as a goods tracking device then maybe it is enough to record its current GPS location etc a few times per hour. When it is not doing any active work it is good to shut it down as much as possible to preserve the battery, and Spresense supports two different sleep modes that it can enter to do this:
-
Deep sleep. This is a state where only the power and audio management unit (CXD5247) and the real-time clock (RTC) are powered on. Because the main CPU is shut down, it is not able to act upon interrupts from external components, for example. However, because the real-time clock unit is still running, it is able to trigger on RTC alarms. This makes the deep sleep mode suitable for applications where you want to wake up periodically to perform a measurement, or other task.
-
Cold sleep. This is a state where the MCU is still powered on but inactive, so it draws a bit more power than deep sleep, but is also able to receive and react upon other events than just clock-based ones. Such an event could be an interrupt from a sensor. This makes cold sleep suitable for applications where some external event should trigger an action and the sleep period is not pre-determined.
To enter these modes from the Arduino library call the coldSleep() and deepSleep() functions in the LowPower Class Reference class.
For more information about power modes please see the SDK Power Management documentation.
7.2. Clock frequency
It is not only how often the application runs that matters, but also how quickly it performs its tasks. The clock frequency determines the speed of operation of the CPU and can be dynamically changed between 156, 32 or 8 MHz.
Note that there are some limitations when limiting the clock frequency. For example:
High-quality audio playback requires 156 MHz but if playback sample rate can be reduced to 44.1 MHz you can probably get away with using a clock frequency of 32 MHz. * Camera requires 32 MHz or 156 MHz * GNSS requires at least 32 MHz. Trying to run it at 8 MHz will only cause it to automatically switch to a higher speed.
However, since the frequency can be set dynamically, you can increase it temporarily only when needed and run at a lower speed the rest of the time. This is especially useful if your app is just idling while waiting for some external event, such as receiving updated positioning data from GNSS.
Setting the clock frequency from the Arduino library is done by calling the clockMode() function in the LowPower class.
For more details about clock frequency control see the SDK Power Saving Control documentation.
7.3. Data storage
Accessing data storage affects power consumption, especially if it is frequently accessed for reading or writing.
-
SD card is good for storing larger amounts of data and is a flexible solution since it can be replaced. It does however, draw quite a lot of power when data is read from or written to it. Exactly how much power depends on the type of card being used but as an example, an old SD card might average above 60 mA during write operations while a newer SDHC card averages around 40 mA.
-
SPI flash is the internal storage of the Spresense board. The space available for use is limited, but no peripheral device is needed and power consumption is significantly lower compared to using an SD card.
EEPROM is a memory type that is traditionally used for small amounts of non-volatile data. In Spresense there is an API for accessing EEPROM, but this implementation is just an emulation that actually uses flash storage, so from a power consumption point of view there is no difference.
7.4. The extension board
Having the extension board connected will cause a slight increase in power consumption of approximately 700 μA. Also, having UART RX and TX on the expansion board, for example, for debugging Spresense without USB connected, will cause it to draw approximately 3.5 mA extra. This is good to know when doing any power measurements.
7.5. Battery and peripherals
Any kind of peripherals connected to the board and the type of battery selected will of course also affect the power consumption and battery life of an application, but the vast number of possible combinations makes this discussion out of scope for this short tutorial.
7.6. Low-power demo
This simple demo shows how GNSS updates might be handled, for example, in a goods tracking use case where low-frequency position updates are enough. A more realistic application would process the collected data and then transmit it to a host. But to keep this demo simple and to avoid having to use external modules, it just prints the data on the UART. For an introduction to the GNSS-related concepts, see the tutorial: How to read GPS information using the Arduino IDE. For this tutorial, we use a standard LiPo 3.7 V battery.
Application outline
A basic outline of the demo application is given here: (download the Arduino sketch):
-
Set the clock speed to 32 MHz.
-
Start GNSS and wait for an initial position reading.
-
When a first position is acquired, prepare for going into deep sleep by:
-
Updating RTC with GNSS time. The RTC keeps ticking while the app sleeps, so we can keep time in sync with the satellites.
-
Saving ephemeris data retrieved from the satellites.
-
-
Deep sleep for a set number of seconds to save power.
-
On wakeup, provide the RTC time (which should be aligned with the satellites' time) to GNSS, to enable starting in HOT_START mode.
-
Make another GNSS reading and prepare for going back to deep sleep again.
This is what the main loop looks like in the demo Arduino sketch:
void loop() {
tries++;
if (getGnssUpdate() ||
(tries >= GNSS_UPDATE_MAX_TRIES && isRtcValid())) {
/* Position aquired, go to sleep */
Serial.print("Sleep for ");
Serial.println(GNSS_SLEEP_PERIOD_S);
Gnss.saveEphemeris();
/* Note: "tries" is reset when the application is reloaded on wake up */
LowPower.deepSleep(GNSS_SLEEP_PERIOD_S);
}
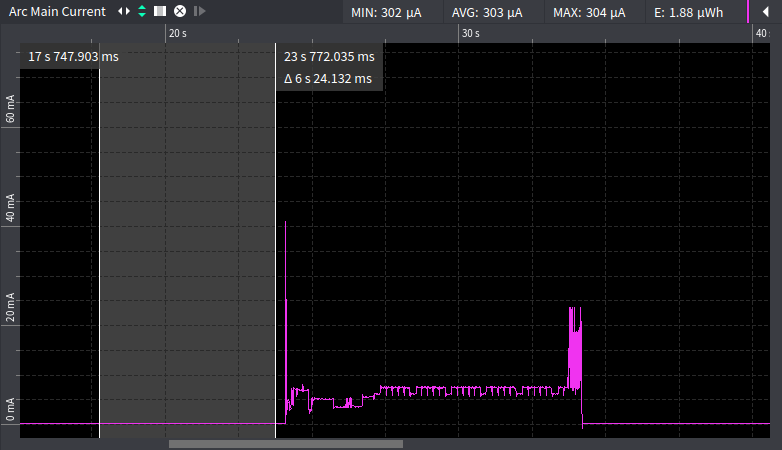
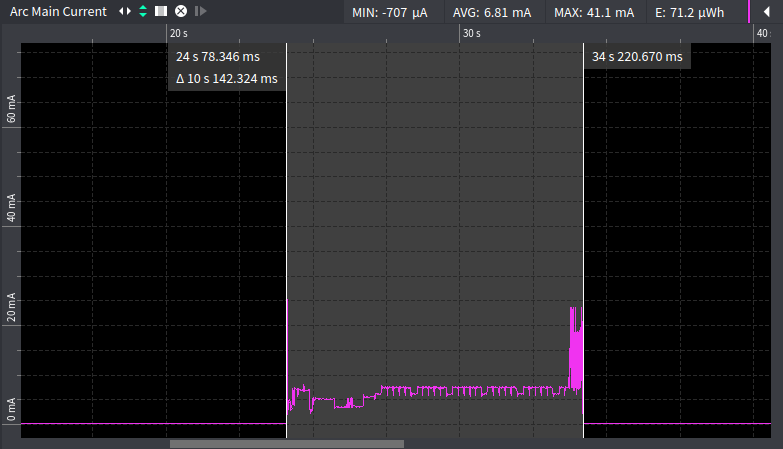
}Sample measurements
One wake cycle (wake up → read GNSS → write SD card → sleep) consumes approximately 7 mA, while during sleep it uses about 300 μA. The application tries to update GNSS data a number of times until it gets a valid update (that is, not cached data), and assuming it takes on average five attempts to achieve this the board will be awake for approximately 10 seconds. Using this we can calculate an approximate value for how much current the board draws per hour for different wake-up frequencies:
| # | Cawake [mA] | Csleep [mA] | Tawake [s] | Consumption per hour [mA]* | 800 mAh [h] | 2000 mAh [h] |
|---|---|---|---|---|---|---|
1 |
7 |
0.3 |
10 |
0.3186 |
2511 |
6277 |
2 |
7 |
0.3 |
20 |
0.3372 |
2372 |
5931 |
3 |
7 |
0.3 |
60 |
0.4116 |
1943 |
4858 |
There are 3600 seconds in an hour, so hourly consumption is calculated as:
Cawake × (Tawake / 3600) + Csleep × ((3600-Tawake) / 3600)
So in theory, if we wake up and check the position every 10th minute, that is, run for 60 s per hour, it will last for 4858 hours or about 200 days on a 2000 mAh battery. In reality however, the battery life will also depend quite a lot on battery discharge characteristic and environmental factors such as temperature.
The following images show examples of graphs of measurements calculating the numbers from the above table:
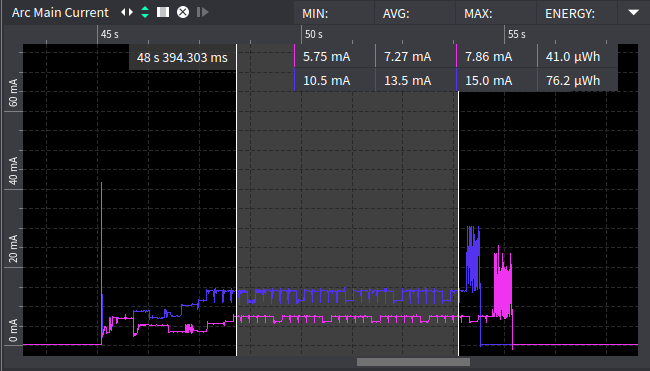
As a side note, it’s worth mentioning that by selecting the clock frequency to 32 MHZ instead of 156 MHz the board only consumes about half the power, especially while waiting for GNSS to respond. This is illustrated in the following graph, where the purple line shows power consumption when running at 32 MHz and the blue line when running at 156 MHz. The averages (AVG) are calculated for the GNSS wait period, that is, the shaded area between the white lines in the graph.
8. How to use the multiple microphone inputs of Spresense with the Arduino IDE
In this tutorial we show how to record from two stereo microphones connected to the Spresense extension board, controlled using the Arduino IDE.
To connect microphones to the Spresense board, you need the Spresense extension board, which has four analog microphone input connection pins.
You can find the hardware specifactions on the Spresense Specifications page. More information about how to connect microphones can be found here.
The Spresense schematic on the Specifications page shows the location of the microphone channels, named A to D.
To record in stereo mode, connect two microphones to inputs A and B, and then select stereo mode (AS_CHANNEL_STEREO) when initializing the recorder. The captured data will have all input from Input A in the left audio channel and that from Input B in the right one.
Similarly, for four channel audio, connect four mics to inputs A to D, and use the mode AS_CHANNEL_4CH when initializing the recorder.
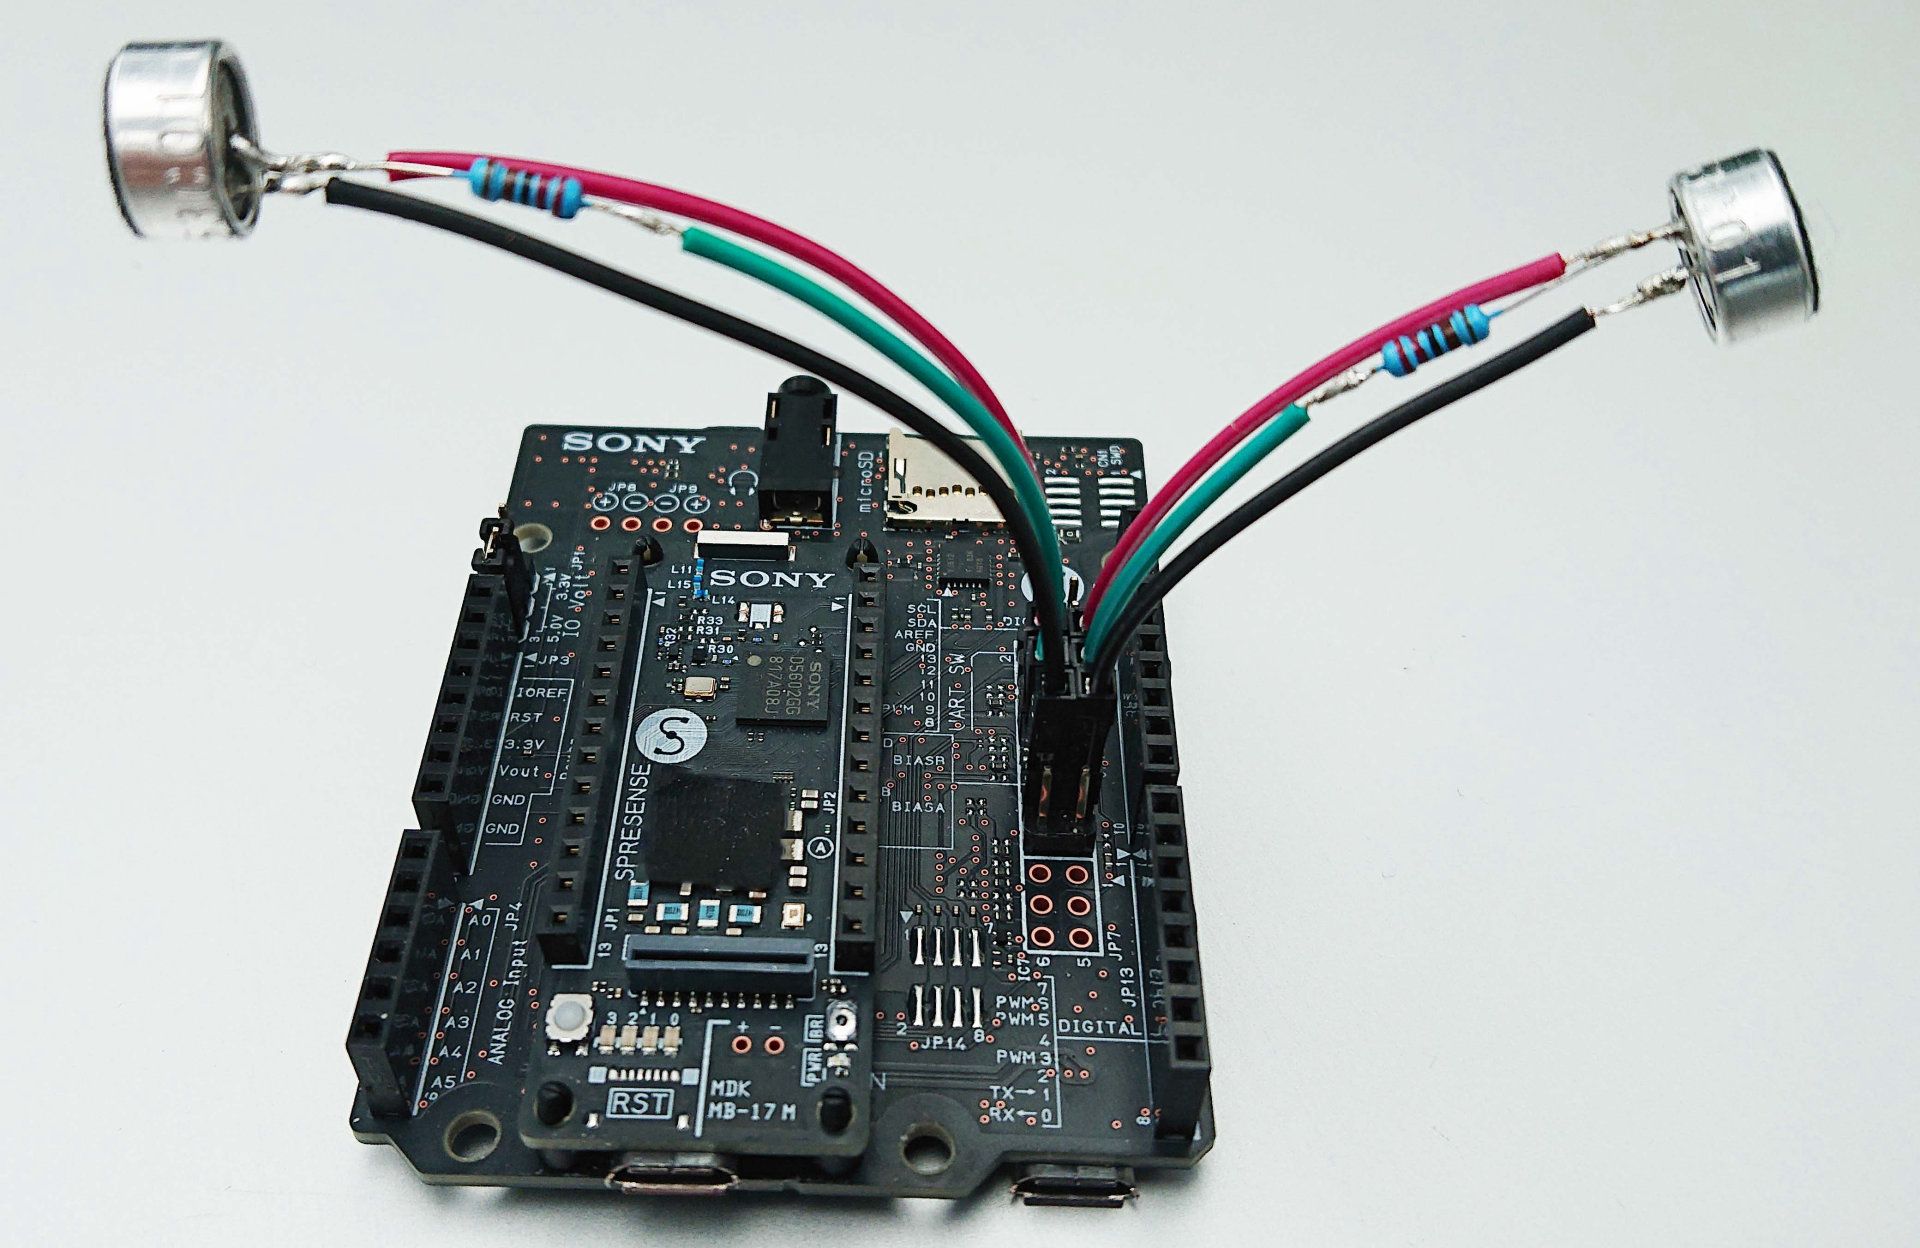
For this quick demonstration of how to record from two microphones simultaneously we will need the following equipment:
-
1 Spresense main board
-
1 Spresense extension board
-
2 Analog electret microphones
-
2 2.2 kΩ resistors
-
Connect the Spresense extension board
Attach the Spresense main board to the extension board if you haven’t already. Detailed information on how to do this can be found at How to attach the Spresense extension board and the Spresense main board.
-
Wiring diagram
Connect the microphones and resistors to the extension board according to the following wiring diagram. In this example we use electret condenser-based microphones, which require a bias voltage on the input line. To supply this we use 2.2 kΩ resistors:

For more information about connecting analog microphones and how to add resistors to the board itself instead (which would void the warranty), see: how to connect analog microphones
-
Set up the Arduino IDE test program
To test the microphones, copy the following sample code into the Arduino IDE and run it on the board. Try to keep the microphones pointing in different directions so it is easy to separate them in the resulting audio.
#include <Audio.h> AudioClass *theAudio; void setup() { theAudio = AudioClass::getInstance(); theAudio->begin(); /* Setup a baseband audio path from mic input to line out */ theAudio->setThroughMode(AudioClass::MicIn, AudioClass::None, true, 160, AS_SP_DRV_MODE_LINEOUT); theAudio->setVolume(-160); } void loop() { /* Do nothing */ } -
Test the output
Connect a stereo headset to the Spresense extension board 3.5 mm connector. If the microphones are properly connected you should hear audio from the microphones in the headset and be able to distinguish between the left and the right one.
-
Run the program in Arduino IDE
Disconnect the headset and run the following program in the Arduino IDE instead:
(If you prefer, you can download the sketch from here: SPRESENSE_MULTIMIC_DETECTOR.INO)
#include <Audio.h> #define READ_PACKET_SIZE 6144 #define BUFFER_SIZE READ_PACKET_SIZE * 4 AudioClass *audio; /* Buffer to keep captured audio data */ char buffer[BUFFER_SIZE]; void setup() { audio = AudioClass::getInstance(); audio->begin(); /* Setup recorder to read from mic input*/ audio->setRecorderMode(AS_SETRECDR_STS_INPUTDEVICE_MIC_A, 150); audio->initRecorder(AS_CODECTYPE_PCM, AS_SAMPLINGRATE_48000, AS_CHANNEL_STEREO); } void loop() { uint32_t temp; uint32_t left = 0; uint32_t right = 0; uint32_t read_size = 0; audio->readFrames(buffer, BUFFER_SIZE, &read_size); audio->startRecorder(); audio->stopRecorder(); /* Audio channels are interleaved and each frame is two bytes (16 bits) like this: "LLRRLLRRLLRR...". Therefore we read 4 bytes at the time and handle them in pairs. */ for (uint32_t i = 0; i < read_size; i += 4) { temp = (buffer[i + 1] << 8) | buffer[i]; if (temp > left) left = temp; temp = (buffer[i + 3] << 8) | buffer[i + 2]; if (temp > right) right = temp; } /* Our simple analysis only keeps track of the highest peak value in each channel and uses this as an indicator of loudness. */ if (right < left) { ledOn(PIN_LED0); ledOff(PIN_LED3); } else if (left < right) { ledOn(PIN_LED3); ledOff(PIN_LED0); } else { ledOff(PIN_LED0); ledOff(PIN_LED3); } } -
Monitor output to LEDs
The application captures audio data for both channels and does a very simple analysis to see which one is the loudest. When making some noise in one of the microphones you should now see the onboard LED indicator on the corresponding side of the board (LED number 0 or 3) light up.
Due to the simplicity of this application there is no filtering etc, so the LEDs might seem to blink a bit at random as the microphones pick up background noise.

9. How to equip Spresense with Bluetooth Low Energy (BLE)
Connectivity based on Bluetooth Low Energy (BLE) is ideal when only local connectivity is needed and the amount of data to be transferred is limited and only sent periodically. This connectivity option consumes very little power.
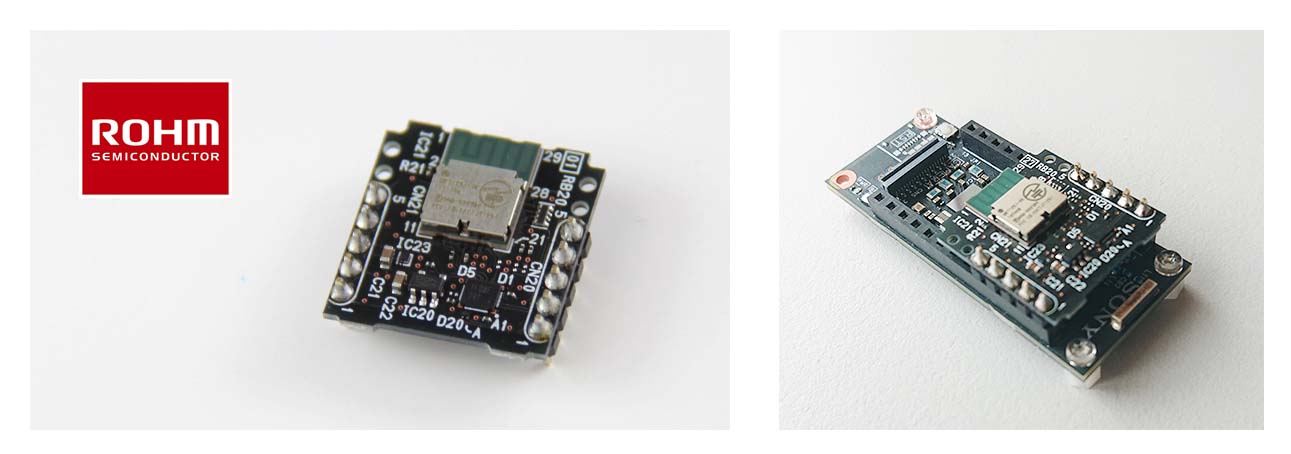
In this tutorial we’ll be doing a simple serial communications test using a BLE board made by Rohm. Here is the list of components we’ll use in the steps below:
-
Spresense main board
-
A Rohm BLE add-on board
-
A micro USB cable
-
A smartphone
| To use the UART pins on the main board when attached to the extension board, connect a 2.54mm pitch jumper to pin 1 and 2 on JP10 of the extension board to disable the extension board UART. For more details see How to use the UART. |
-
Setting up Spresense for BLE
-
To equip the Spresense development board with BLE, plug in the Rohm add-on board onto the main board of Spresense.
-
Download this repository: https://github.com/RohmSemiconductor/Arduino
We will use the sample in the
MK71251-02folder. -
Open the
MK71251-02.inosketch in the Arduino IDE and upload it to Spresense through the USB cable.
-
-
Set baud rate
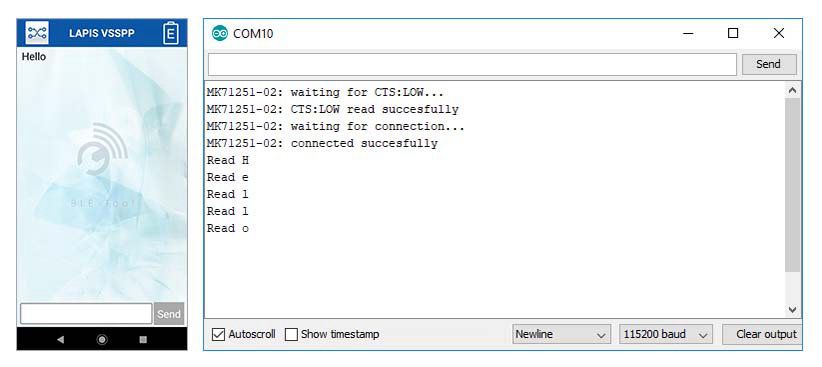
Open the serial monitor of the Arduino IDE and set the baud rate to 115200.

-
Download the BLE app
-
To communicate with the Spresense board, download the app BLE Tool from Lapis Semiconductor to the smartphone.

-
Open the app and find the device in the list with the name
LapisDev. This is the BLE name of the Spresense unit set by theMK71251.cppfile.
-
-
Transmit characters through Serial Port Profile
-
Connect to the device from the smartphone and open the Serial Port Profile.
-
Type Hello and press Send. You will see the characters transmitted using BLE to the serial monitor. If you send a capital Z, then the Spresense unit will send the characters WRITING TEST back to the smartphone.
The BLE add-on board uses AT commands to control the communication. To get the full AT command specification, register and log in to the Lapis Semiconductor support site: https://www.lapis-semi.com/cgi-bin/MyLAPIS/regi/login.cgi
-

10. Multicore programming with Spresense using the Arduino IDE
An interesting feature of the Spresense development board is that it allows for multicore programming using the Arduino IDE. Spresense is powered by 6 ARM cores running at 156 MHz, which is many times faster than most Arduino boards.
Once you have set up your Arduino IDE for Spresense, there are two simple step-by-step tutorial examples that explain how to do multicore programming using the Arduino IDE:
-
Multicore Boot example This example shows how to start and control the main core with the subcores.
-
Multicore MessageHello example This example shows how to communicate between the cores by sending the address of messages using shared memory.
For additional details on multicore programming using the Arduino IDE, there is a dedicated chapter in the Spresense Arduino IDE developer guide called: MultiCore MP Library.