Predictive maintenance with Spresense
This is a tutorial for using Spresense in predictive maintenance (PDM) applications where it can be used to read input from an industrial accelerometer attached to an electrical motor, process the data and then send it to a cloud-based PDM service. The sensor is connected to the microphone input A of the Spresense extension board. The reason for doing this instead of using one of the analog A/D inputs is that it can handle higher sample rates and thus provide readings with a higher fidelity. To understand the basics of PDM and what it is, you can have a look at this short blog post: Using Spresense for predictive maintenance
The web service
The PDM service used in this demo is senseye.io. Senseye is a highly professional PDM service provider that specializes in receiving all kinds of sensor data from their customers and then using advanced data analysis methods to do on point predictions about maintenance needs.
To support some other service instead of senseye.io, the source code needs to be modified to support the new REST API. The API strings and the functions handling them are located in:
examples/pdm_demo/pdm/api_senseye.c
The hardware
The hardware components used in this demo are:
The sensor will be connected to one of the microphone inputs of the Spresense extension board so that it can be sampled at a high frequency. There are a number of manufacturers producing accelerometers with different forms, outputs and sensitivity levels. However, whichever one you choose, the sensor output signal needs to be converted to a level within the range that the microphone input can handle (0-1.8 V). Also, we have to provide power to the sensor itself.
To satisfy these requirements, the Integrated Electronics Piezo-Electric (IEPE) sensor interface is implemented. In general terms, this means that the sensor circuit is driven by a constant current and both the power supply and the sensor signal are transmitted using a single shielded coaxial cable. In the instrument end, where the signal is read, there is a coupling capacitor to get rid of the DC component of the input and only keep the actual sensor signal.
As well as the IEPE specific components mentioned above, we also need to bring the signal voltage down to a level that the Spresense board microphone input can handle, so a small voltage divider circuit is needed. An overview of the setup is shown below:

The illustrations (a, b and c) at the bottom show how the signal changes around the zero voltage baseline at different points in the network. A detailed schematic can be found in the practical instruction below.
Below steps covers the set-up and how to run the software.
1. Software structure
The source code is divided into a number of modules with the most important ones shown in the illustration below:

Connectivity handling
The connectivity modules (Senseye API and Net) handle setting up the Wi-Fi hardware, setting up the HTTPS connection to the server and sending and receiving HTTP requests and responses. The API module is web-service-specific and needs to be modified/replaced if another service using another REST API is used.
Signal processing
The signal processing modules (Process and Sigproc) do all signal processing operations on the acquired vibration data. The Process module is the main interface for this and is called whenever a data buffer is available when measuring. It does a bit of time domain processing itself and interface module, to the DSP where the FFT is run.
Data collection
The Audio module records vibration data from the microphone input as if it was regular audio data. When a full data buffer is acquired, it is sent back to the caller using a callback function. In this demo, recording is done using a single channel with a sample rate of 48 kHz.
Data handling
The DataHandler module is responsible for taking the data processing result received from the DSP, converting it to a JSON string and keeping it in a temporary storage (the SD card). When a report is to be generated and sent to the server, this module reads all the previously stored JSON data, generates the complete JSON structure to be sent and then prepares the temporary storage for receiving new data.
Scheduling
To make sure measurements are taken and data is reported in a timely manner at a specific interval, a simple “Scheduler” module is introduced. At application start-up, one or more tasks (callback functions) are registered together with the interval at which it should be run. The application then handles control over to this scheduler, which goes to sleep and only wakes up when any of the registered tasks are supposed to be run.
2. Software execution flow
In the default setup, the Scheduler component keeps track of two different tasks that are being run at different intervals: one measuring task that does data collection and processing, and one reporting task that sends the aggregated data to the web service. The general flow of the application can be seen in the illustration below. Note that the colors correspond to those of the components in the previous image:

3. Measurement processing
The measurement data is processed by the software to extract a number of different condition indicators, which are eventually sent to the web API. Calculations that depend on frequency analysis using Fast Fourier Transforms (FFT) are done on one of the sub-cores, which acts as a dedicated DSP. Implementations of FFT and other signal processing algorithms are provided by the CMSIS DSP library which is included in the Spresense SDK. The following indicators are calculated and reported to the web service in this demo:
1xRPM, 2xRPM and 3xRPM
These are the frequency components at one, two- and three-times running speed. So, if the motor runs at 1500 RPM, which equals 25 Hz, then 1xRPM will show the waveform energy around that frequency. 2xRPM and 3xRPM do the same thing but show the energy at two and three times the frequency respectively. An increase in these values could indicate that the shaft is misaligned or bent.
Bearing BPFO, BPFI, FTF and BSF
BPFO (Ball Pass Frequency Outer race), BPFI (Ball Pass Frequency Inner race), FTF (Fundamental Train Frequency) and BSF (Ball Spin Frequency) are characteristic frequencies that show different aspects of a bearing. As with 1xRPM etc. mentioned above, they show the energy at those specific frequencies and indicate faults in different parts of the bearing itself. These frequencies are specific to the model of the bearing being used and should be provided by the bearing vendor.
RMS
RMS (Root Mean Square) is a mean measure of the overall energy in the waveform. An increase here does not pinpoint a specific problem but is a general indication that there might be an issue, such as shaft misalignment, a faulty bearing or something else.
Crest Factor
The crest factor is the ratio of the peak signal value to the RMS. Like RMS, this is also not a very specific indicator and an increase of this value could imply a number of different issues.
Peak to Peak
This value indicates the maximum difference between the lowest and the highest signal value, that is, the spread, in the waveform. This does not pinpoint any specific error, but if this increases it means that there is a general increase in vibrations, which could be a warning signal that something is wrong.
4. Set up the hardware
Prepare the adapter
Prepare the adapter circuit board according to the schematic below. The exact values of the components might have to be adjusted depending on sensor type and other factors.

- The voltage supplied to the circuit (a) should be at least 18V.
- A constant current source (b) is used to drive to the sensor. In this example an adjustable regulator of type LM317 is used, but this could be replaced with a current-regulating diode (CRD).
- The coupling capacitor (c) removes the DC component (the bias voltage) resulting in a zero-centered AC signal that only includes the vibration data.
- The resulting sensor signal needs to be scaled down to a level that the microphone input can handle (0-1.8V), and this is accomplished with a regular voltage divider (d).
- The diode serves as an overvoltage protection, protecting the sensor and the Spresense board during unexpected power surges.
- Make sure that proper shielding of the cable used to connect the sensor (f) is applied to achieve a good signal to noise ratio. Make sure it is properly grounded.
Connect the sensor
- Attach the board to the microphone, (MIC A), input and ground pins on the extension board. The bias pin (MIC BIASA) is not used. Please refer to the microphone pin header overview.
Prepare the Spresense board
- Attach the Wi-Fi addon module to the Spresense main board. Please reference the images on the this site to make sure it is put in the right place.
- Attach the main board to the extension board.
5. Set up the software
Get the source code
The code for this demo is located in the following Github repository: https://github.com/sonydevworld/spresense-tutorials.git
This repo only contains Spresense demo applications and the corresponding configuration files. To build it you must first download and setup the SDK according to the one of the Spresense SDK Getting started guides in the documentation.
Once you have the SDK in place, download the Spresense tutorials source code repo by running:
git clone https://github.com/sonydevworld/spresense-tutorials.git
cd spresense-tutorials
From this downloaded repo, copy the whole directory of the example application (“pdm_demo”) into the “examples” directory of your Spresense SDK.
Also copy the folder containing the corresponding configuration (in this case ”configurations/pdm_demo”) into the “sdk/configs/examples” directory of your SDK.
When all the source code is in place, change working directory to the “sdk” folder of your SDK repo and proceed with building it.
Build and flash the software
Building the software is done as with any other Spresense SDK application. When you have downloaded the code, enter the “sdk” subfolder and run:
./tools/config.py examples/pdm_demo
./make
The build process will result in two separate binary files. The main software is flashed as usual:
./tools/flash.sh -c nuttx.spk
The DSP signal processing binary should be placed on the SD card so that the main software can find and load it at startup:
- Create a new directory called “BIN” in the root of your SD card.
- Copy the file “examples/pdm_demo/sigproc/dsp/DSPFFT” into the BIN folder on the SD card.
Configure the software
The software is configured by providing a configuration file that must be placed on the . The reason for this setup is to enable reconfiguration without having to rebuild the software and flash the board. It also avoids having to keep login credentials and other sensitive data in the source code.
A template file is available at “examples/pdm_demo/config/pdm.config”. The configuration is specified using the format “: ”, and lines starting with a hash (“#”) are comments and will be ignored.
The settings include Wi-Fi and web API login credentials, sensor and bearing specifications, and motor speed. Fill in the missing values to match your setup and copy the file to the root of the SD card.
6. Run the demo
The demo is prepared so it can either be manually started (the default configuration) or run automatically at startup.
To manually start the application:
- Start a serial terminal application on your PC.
- Connect the Spresense board to your PC using a USB cable.
- When the command prompt is available in the terminal application, run:
pdm_demo
To make the application start automatically when the USB cable is connected, modify the SDK according to these steps:
- In the “SDK” folder, run:
make menuconfig - When the configuration UI pops up, enter the
RTOS Featuresmenu and selectTasks and Scheduling - Set the value of “Application entry point” to:
pdm_demo_main - Save the configuration and exit menuconfig.
- Build the software and flash it to the board
Note: At startup, the application will try to automatically sync system time over the network. If it fails to establish a connection for this the board will restart and try again.
The startup sequence of the application is shown below:
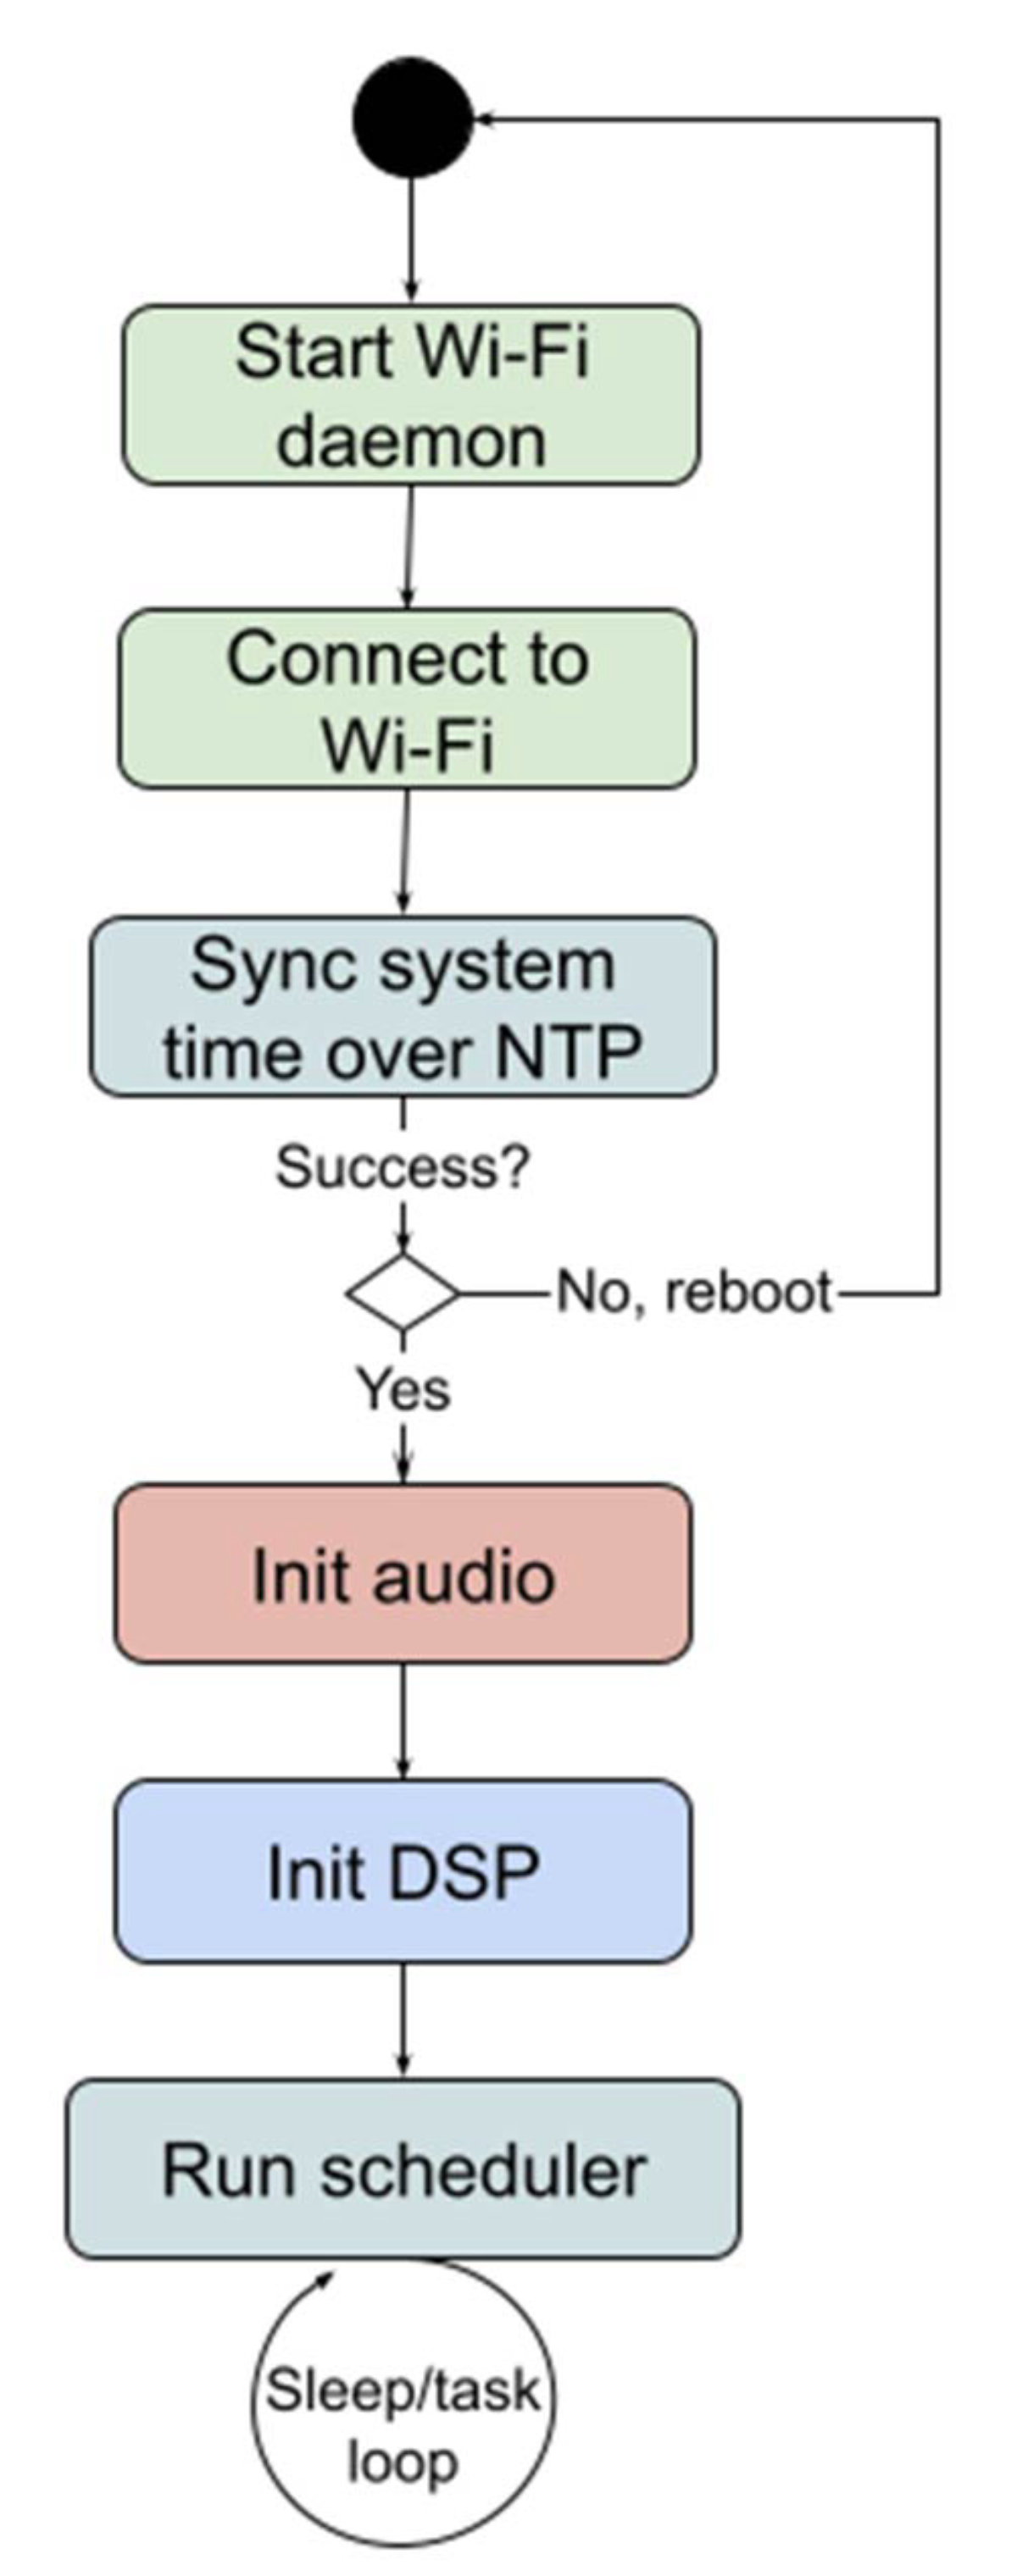
Once the demo is up and running, you should see in the log when application sleeps, wakes up to do a measurement or sends a report to the server.
Note: If you don’t have a Senseye account and just want to test doing measurements without actually sending anything, you can disable the command that does the reporting:
- Open up the source file “pdm_demo_main.cxx”
- Find the line:
//#define SKIP_API_POST - Uncomment it so you get:
#define SKIP_API_POST - Rebuild and flash the application.